Two data trackers looked at Montecito over the same stretch of 2026 and came back with opposite headlines. One said the median home price fell double digits from a year earlier. Another said the median rose. Both were using real closed-sale data. Neither was wrong.
That contradiction is the whole story if you're trying to figure out what Montecito actually costs right now, or whether it's a good time to buy or sell here. The short answer is that "the median" stopped being a useful single number sometime in 2026, because two very different markets are operating inside the same zip code, and which one shows up in a given data pull depends entirely on the measurement window.
Two trackers, two different summers
Through the first half of 2026, Montecito's median sale price settled lower than it had been at the end of 2025, part of a broader Santa Barbara South Coast pattern of recalibrated pricing after several years of pandemic-era acceleration. Sales volume across the region actually climbed nearly 12% over the same period a year earlier, and months of inventory sat around 1.9, well under the 4 to 6 months that typically signals a balanced market. Zoom into Montecito and neighboring Hope Ranch specifically, which local MLS reporting usually tracks together, and June 2026 told an even sharper version of the same story: the median sale price reset lower, closed sales surged close to 60% compared with June 2025, and homes moved faster than they had earlier in the year.
Meanwhile, looking at the same stretch through a different lens, Montecito's median sale price over the trailing three months ending June 2026 was actually up 6.6% year over year to $7.3 million, and homes in that window sold after roughly 45 days on market, barely different from 44 days the year before. In a separate one-month snapshot around the same time, Montecito's average sale price came in at $6.05 million, up 14.2% year over year. A separate tracker's August 2026 read showed median list prices down 17% year over year and listings moving 22% faster than the year before.
Here's the detail that resolves it. Over that same trailing three-month window where the median sale price rose, the median price per square foot actually fell 9.47% year over year. If the typical dollar-per-foot value of Montecito real estate is dropping while the median sale price is climbing, the math only works one way: a larger share of very large, very expensive homes closed escrow during that window. The trailing median isn't measuring appreciation. It's measuring which homes happened to sell.
What actually moved: the mix, not the value
| Metric | Window | Figure | Direction vs. prior year |
|---|---|---|---|
| Montecito median sale price | H1 2026 | ~$5.75M | Down from year-end 2025 |
| Montecito median sale price (trailing 3 mo.) | Through June 2026 | $7.3M | Up 6.6% |
| Montecito average sale price | Mid-2026 | ~$6.05M | Up 14.2% |
| Median price per square foot | Trailing 3 mo. through June 2026 | $1.81K | Down 9.47% |
| Median list price | Aug. 2026 | $7.39M | Down 17% |
| Average days on market | Trailing 3 mo. through June 2026 | ~45 days | Roughly flat (44 days prior year) |
| Closed sales, Montecito/Hope Ranch | June 2026 | — | Up ~60% |
Read across that table and a pattern appears. The "typical" transaction, the one that sets the standard median, got cheaper and faster in 2026. Sellers recalibrated after several years of aggressive pricing, and buyers responded with real competition on properties priced to where the market actually is. At the same time, a separate tier at the very top, the estates that command $10 million and above, kept closing at a pace strong enough to pull the trailing average and the rolling three-month median upward, even as the everyday middle of the market softened underneath it.
This isn't unique to Montecito, but it shows up here more visibly than almost anywhere else on the South Coast, because Montecito's inventory is so thin to begin with. As of mid-2026, only around 61 homes sat in active inventory across the entire town, with roughly 13 closing in a recent 30-day stretch. When your total sample size is that small, a handful of trophy closings can swing the average by a wide margin without saying anything about what a typical buyer will pay for a typical home.
Where the split actually lives
Montecito isn't zoned into formal neighborhoods so much as it's understood through informal geography, and that geography maps almost exactly onto the price split described above.
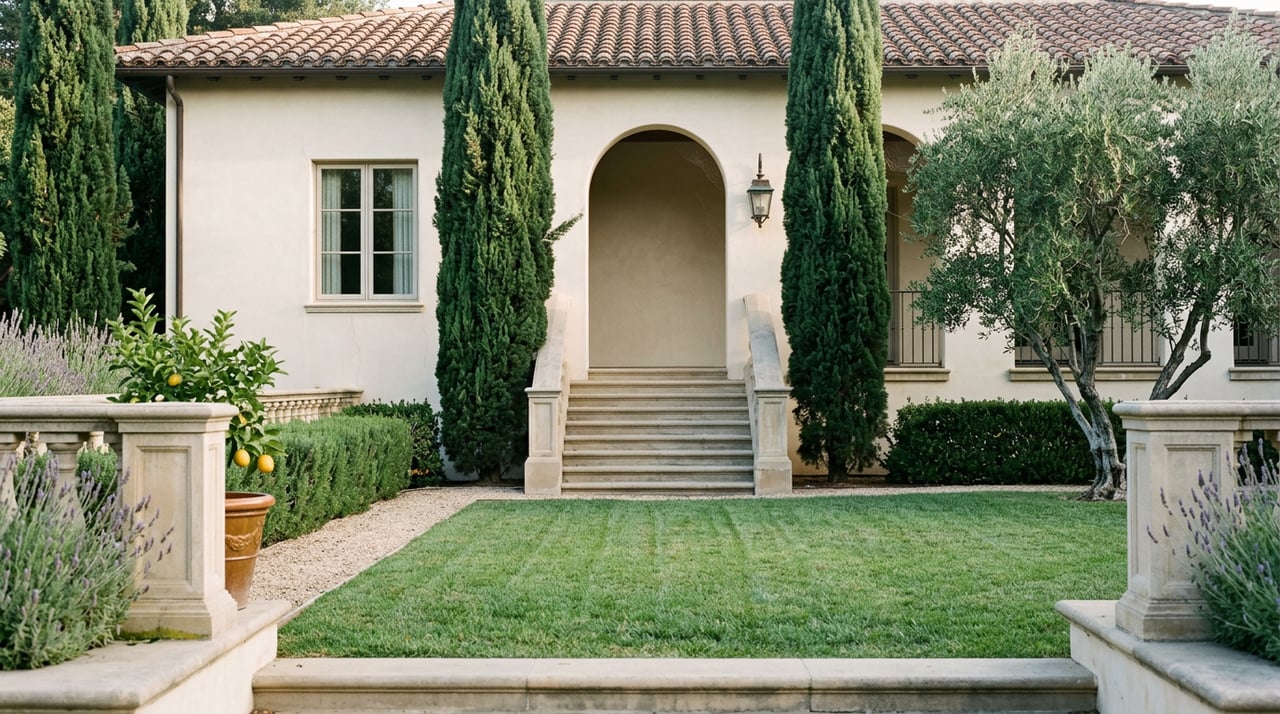
The Upper Village, centered near the intersection of East Valley Road and San Ysidro Road, sits in the foothills closer to trailheads like Cold Spring Trail and San Ysidro Trail, and includes the historic grounds near San Ysidro Ranch. Homes here tend to sit on larger, more secluded parcels with longer driveways and more separation from the road, which is exactly the kind of inventory that anchors the top of the market. Within that same foothill geography, the Golden Quadrangle carries some of Montecito's most storied addresses, including estates built in the Spanish Colonial Revival tradition associated with architect George Washington Smith, with current asking prices commonly running from $10 million to $20 million or more. Riven Rock, similarly removed and heavily wooded, tends to price between $10 million and $25 million.
The Lower Village tells a different story. Centered on Coast Village Road, walkable to the Rosewood Miramar Beach, the Montecito Country Mart, and Butterfly Beach, this stretch trades acreage for proximity, with prices ranging roughly from $3 million to $10 million depending on whether the property is a condo, a cottage, or a detached single-family home. The flat, hedge-lined area known locally as Hedgerow sits in a similar attainable-by-Montecito-standards range.
That's the mechanism in plain terms. When a Golden Quadrangle or Riven Rock estate closes, it closes at a price point that can singlehandedly move a rolling average. When several Lower Village cottages close in the same window, they pull the typical transaction down and speed up the average days on market. Both are true at once. Neither cancels the other out.
I tell clients directly that the number they saw on a portal last week is already describing a market that's moved. In a town with 61 active listings, one estate closing changes the headline.
What this means if you're comparing neighborhoods
If you're shopping Montecito against another South Coast area, or against a different price point within Montecito itself, a single median from any tracker is close to useless on its own. What actually matters:
- Which price band are you buying or selling in. A Lower Village cottage and a Golden Quadrangle estate are not competing in the same market, even though both show up under "Montecito" in the data.
- What's actually closing right now, not what's listed. With so few transactions each month, the composition of last month's closings can shift the picture entirely.
- Whether the property is turnkey. Across every source in this market, move-in-ready homes are closing closer to list price and faster, while properties needing real work are sitting longer and eventually needing a price cut to find a buyer. That gap matters more in a low-volume market like this one than it would somewhere with hundreds of monthly sales to average out.
- Sale-to-list ratio, not just sale price. Montecito has been running close to 96% of asking price across most of 2026, which tells you realistic initial pricing is doing more work than negotiation once a home is under contract.
A few questions worth asking directly
Did Montecito get cheaper or more expensive in 2026? Both, depending on which transaction you're looking at. The typical, middle-of-the-market home priced lower and sold faster than it had the year before. The ultra-luxury tier kept closing at levels that pulled the trailing average and three-month median upward. Ask which segment you're actually buying or selling into before you anchor to any single headline figure.
Why would homes sell faster if the median was falling? Because sellers who priced to where buyers actually were generated real competition, while overpriced listings sat and eventually needed adjustments. Faster days on market and a lower median aren't contradictory. They're often the same recalibration showing up in two different metrics.
Is the Upper Village or Lower Village a better bet right now? Neither is objectively better. They serve different buyers. The Upper Village trades walkability for privacy, acreage, and proximity to trailheads, while the Lower Village trades acreage for walkable access to Coast Village Road and the beach. Your answer depends on what you actually want your daily life to look like, not on which area's median is higher this quarter.
If you're trying to figure out where your search or your listing actually fits inside this market, a single online estimate isn't going to tell you. Work With Kendrick Guehr for a direct read on current comparables in your price band and neighborhood, and a pricing conversation grounded in what's actually closing, not just what's listed.